Hi again. The stock I am currently invested in (Trevali Mining Co.) has gone up once again. :) Today it closed ↑1.1% Higher than Friday. Zynga, on the other hand, is now down to ↓$9.05. This is interesting because of all they hype it had... Now experts are saying it might drop as low as $6.00... Now I am kind of glad I didn't put any money into it. :)
Anyways, about that bar chart I promised to talk about today. That chart illustrates the volume of traders in the corresponding time frame. Green stands for buyers and red stands for sellers. The colors may vary from chart to chart. If you are checking out stocks and notice a high volume of buyers it's a good indication that the stock is going to go up. However, make sure you aren't too late if you do decide to buy. That's all I've got for today. I am currently learning a lot about candle stick charts. I recommend using a candle stick chart when you are studying a stock. I will let you know why in my next few posts. There is A LOT you can tell about a stock by using these charts.
James
Monday, 19 December 2011

Friday, 16 December 2011
The ADX indicator
Hello! If you remember, or were reading, a couple posts ago I said I would be talking about how to identify if a trend is strong or weak and which way it's going. However, I would first just like to say that the stock I bought yesterday (Trevali Mining Corporation. TSX: TV) Has gone up $0.03 (3.55%) Since I purchased it. That's like $20 in my pocket! Also, Zynga. The stock I was talking about the other day. The one that it anticipated to be as strong as google has dropped ↓5% from $10.00 to $9.50. For the people who got in early, this is a bad thing. But for anyone who still hasn't made a purchase, this could be a good thing. 40 million shares of this stock were purchased when the market opened. The stock jumped up 25% and then a lot of people sold bringing it crashing down to $9.50. Since then it has been pretty steady for the rest of the day. I don't think it is going to go much lower than that. I think it's all uphill from here for the next little while. Unfortunately I do not have money to buy shares. At least not that I am willing to spend. If my current stock goes well and I sell soon, I will be putting my money into Zynga if it hasn't gone up too much by then. My guess is though, that tomorrow a lot of people will buy it again and it will jump even higher than $12.50 and it will keep "waving" its way up from there. Never quite dropping as low as it did the time before. ANYWAYS! Enough of that!
How to tell what a trend is doing: this is not a perfect science. But it sure is helpful. When looking at a chart you want to take note of what way the stock is moving. Is it trending upwards or downwards? Now, look at the ADX indicator. It is a horizontal line on a chart that ranges from 0 -100 (might look like 10-90)depending on the range it passed through during the time line of the chart. Here's an example, outlined in red, from the stock i talked about earlier. (TSX: TV)

If the line goes above 30 this is a really good thing. It means you are looking at a pretty strong trend. If you want to be really safe you would invest in stocks that are trending in an upward manner of 30 or more. The ADX will not tell you if it is moving up or down. Only how much "momentum" it has. It's up to you to decide if it is going up or down. A good way is to try and recognize the "waves" and "stages" I talked about in my earlier posts. If you looked at Zynga right now (as I am typing this) you would see that the ADX is over 60 right now! And this stock is not going down! Sorry, I got excited. Anyways, that's all I have for you today. Hope you learned something. Next time I will tell you about the bar chart above the ADX indicator :)
James
How to tell what a trend is doing: this is not a perfect science. But it sure is helpful. When looking at a chart you want to take note of what way the stock is moving. Is it trending upwards or downwards? Now, look at the ADX indicator. It is a horizontal line on a chart that ranges from 0 -100 (might look like 10-90)depending on the range it passed through during the time line of the chart. Here's an example, outlined in red, from the stock i talked about earlier. (TSX: TV)

If the line goes above 30 this is a really good thing. It means you are looking at a pretty strong trend. If you want to be really safe you would invest in stocks that are trending in an upward manner of 30 or more. The ADX will not tell you if it is moving up or down. Only how much "momentum" it has. It's up to you to decide if it is going up or down. A good way is to try and recognize the "waves" and "stages" I talked about in my earlier posts. If you looked at Zynga right now (as I am typing this) you would see that the ADX is over 60 right now! And this stock is not going down! Sorry, I got excited. Anyways, that's all I have for you today. Hope you learned something. Next time I will tell you about the bar chart above the ADX indicator :)
James
Thursday, 15 December 2011
My first purchase. FOR REAL!
Wooo! I just bought 600 shares of Trevali Mining Corporation THROUGH MY TFSA! It is listed on the TSX as TV. This is a Canadian company that mines copper and zinc. It is currently selling at $0.83 cents per share after a recent drop from around $2.30 earlier this year. Here is the Year To Date Chart.

As you can see it has clearly gone through stage 4 of its last cycle. I believe it is now leveling off and ready to go back up. I didn't decide to buy it solely on the fact that it has leveled off. That was actually the second reason why I bought it. Before I did anything, I looked it up. On December 7th this company staked five additional claims to mine at, adding 1,130 more hectares of land to its already 3764 hectare stake bringing it to a total of 4894 hectares. This is a good sign that they have a pretty good idea that there is more copper and zinc to be found. If that wasn't enough, today they have just received a lease for yet another mine in which they believe is full of zinc, copper, lead, and gold. The lease is good for twenty years and they are able to renew it for twenty more years up to a total of 80 years. This is a good sign that there is plenty to be dug up! Furthermore, They have already told Xstrata Zinc Canada's Brunswick 12 Processing Mill and Concentrate Complex to expect delivery of feed over the upcoming weeks. I am pretty damn excited! :) I didn't buy a whole lot of shares, but this is my first trade. If I even make $5 I will be happy. Anyways, That's all for now! See you next time!
James

As you can see it has clearly gone through stage 4 of its last cycle. I believe it is now leveling off and ready to go back up. I didn't decide to buy it solely on the fact that it has leveled off. That was actually the second reason why I bought it. Before I did anything, I looked it up. On December 7th this company staked five additional claims to mine at, adding 1,130 more hectares of land to its already 3764 hectare stake bringing it to a total of 4894 hectares. This is a good sign that they have a pretty good idea that there is more copper and zinc to be found. If that wasn't enough, today they have just received a lease for yet another mine in which they believe is full of zinc, copper, lead, and gold. The lease is good for twenty years and they are able to renew it for twenty more years up to a total of 80 years. This is a good sign that there is plenty to be dug up! Furthermore, They have already told Xstrata Zinc Canada's Brunswick 12 Processing Mill and Concentrate Complex to expect delivery of feed over the upcoming weeks. I am pretty damn excited! :) I didn't buy a whole lot of shares, but this is my first trade. If I even make $5 I will be happy. Anyways, That's all for now! See you next time!
James
Happy X-mas, NASDAQ!
Today is the day that Zynga FINALLY registered an IPO. Look them up under ZNGA. This is the most anticipated IPO since Google! Google started at $85.00 per share and is now at around $620.00. Zynga started today at only $10.00 per share. I will not be buying any shares because I simply don't have enough money to make a reasonable purchase... Also, by market opening in the morning, Wall street will be packed with investors and there probably won't be any shares left to buy at around 9:05am. This stock is expected to make a lot of millionaires and even billionaires. I personally will be torturing myself watching this one for years to come, wishing that I maxed out my line of credit to get a piece. Just thought I would put that out there. This blog is now a piece of investing history. One of the many posts that was posted the day Zynga entered the public market. That's all for now.
James
James
Wednesday, 14 December 2011
Stages of a stock
Today I want to talk about the stages in which a will pass through. The basic rule to follow when trading stocks is: Buy low sell high! Obvious, right? But how can you tell if a stock is low or high? A stock at $200 could be considered low while a stock at 8 cents could be considered high... It all depends on where it came from and where it is expected to go. You should never judge a stock by its chart alone. Always research your stock and see if the company has any new developments or business deals that are very recent or happening in the near future that may financially benefit the company. There are four stages in a stock. Stage 1, stage 2, stage 3, and, you guessed it! Stage 4! Here is a basic line drawing that I pulled off the internet:

I heard somewhere that stocks are not a reflection of of what IS happening. But a reflection of what is going to happen. You can see that stage 1 is when the stock has come from a recent spill and is now leveling off. This is when an experienced trader will be purchasing the stock. Stage 2 is when it is starting to climb again. This is what happens after a bunch of people have purchased a bunch of shares. Simple supply and demand. More people buying, price goes up. Stage 3 is when the stock starts to plateau. This is when all the experienced traders are looking to sell. A lot of inexperienced traders such as myself may have just caught wind of recent developments in the company and can already see the price starting to rapidly increase. We want to buy! Bad mistake. Once all the big players sell off their shares there is now more supply than demand and the stock moves onto stage 4. The downward trend. This is where you lose your money. This is why you do your research. Don't follow every stock tip you hear. Now the stock will eventually move back into stage 1 and repeat. All stocks trade at different speeds. There is no way to tell what will happen and when just by looking at a chart. It just helps to know what you're looking at. If you look at a chart you will also notice that stocks do not climb and fall in such a smooth manner. They go up and down on their way through the different stages. These are called waves. Here is another picture to help you understand.

Stage 1 involves wave 1 and 2. Stage 2 is wave 3, and wave 4. Wave 5, and wave A are stage 3. It is very important to be able to recognize these stages and NOT to let your greed cloud your decision to SELL. If you are good enough you will be able to identify and sell at wave 5. Wave B and wave C are stage 4. You do not want to own shares at this time. That's all for learning today. I suggest that you go look up some of your favorite stocks and see if you can analyze the charts. Next time I will be talking about ways to identify how strong the trend is and how to identify it so you know when to buy or sell :) Here is a 3 year chart of Tempur Pedic International Inc. If you click it you can see that it has just entered stage 4 and either wave B or C. Time to sell!

Happy trading!!
James

I heard somewhere that stocks are not a reflection of of what IS happening. But a reflection of what is going to happen. You can see that stage 1 is when the stock has come from a recent spill and is now leveling off. This is when an experienced trader will be purchasing the stock. Stage 2 is when it is starting to climb again. This is what happens after a bunch of people have purchased a bunch of shares. Simple supply and demand. More people buying, price goes up. Stage 3 is when the stock starts to plateau. This is when all the experienced traders are looking to sell. A lot of inexperienced traders such as myself may have just caught wind of recent developments in the company and can already see the price starting to rapidly increase. We want to buy! Bad mistake. Once all the big players sell off their shares there is now more supply than demand and the stock moves onto stage 4. The downward trend. This is where you lose your money. This is why you do your research. Don't follow every stock tip you hear. Now the stock will eventually move back into stage 1 and repeat. All stocks trade at different speeds. There is no way to tell what will happen and when just by looking at a chart. It just helps to know what you're looking at. If you look at a chart you will also notice that stocks do not climb and fall in such a smooth manner. They go up and down on their way through the different stages. These are called waves. Here is another picture to help you understand.
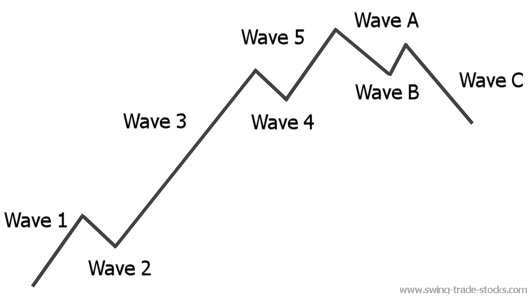
Stage 1 involves wave 1 and 2. Stage 2 is wave 3, and wave 4. Wave 5, and wave A are stage 3. It is very important to be able to recognize these stages and NOT to let your greed cloud your decision to SELL. If you are good enough you will be able to identify and sell at wave 5. Wave B and wave C are stage 4. You do not want to own shares at this time. That's all for learning today. I suggest that you go look up some of your favorite stocks and see if you can analyze the charts. Next time I will be talking about ways to identify how strong the trend is and how to identify it so you know when to buy or sell :) Here is a 3 year chart of Tempur Pedic International Inc. If you click it you can see that it has just entered stage 4 and either wave B or C. Time to sell!

Happy trading!!
James
Tuesday, 13 December 2011
Time to learn more!
So, I am still watching AMWI for the fun of it. It's all over the place. Up 50%, down 75%, up 100% more... I can see potential to make money from it if you are very intuitive and buy and sell at the right times... I do need to find new stocks to invest in though. I was thinking to myself... How the hell does anyone find the right stock to invest in? Nobody ever got rich off playing stock tips their whole lives... They had to go out there and do their own research... But where do you start? Well, if you know how to analyze a stock chart properly you would definitely have a head start. There is actually a formula to finding great stocks. :) So, I will tell you what I learn about these charts as I go. As for now, I have a lot of reading to do! Talk to you soon!
James
James
Thursday, 8 December 2011
Was AMWI a Pump and dump?
Today I was at work kicking myself for deciding to wait until the new year to get a less restricted investment account set up. The stock I am watching (AMWI) Was up to $1.40 a share from the $0.23 it was at when I tried to buy it initially. That is almost a 700% gain! But then at around 1:00 in the afternoon in plummeted all the way back down to $0.26 a share almost instantly. I still would have made money, but I would have been real pissed if I had have lost my 700% gain. Although, I probably would have gotten scared and sold it at about 100 or 200% Either way, it really sucks for all the people out there that had large quantities of money riding on this stock. This is a classic example of why it is important to do your research. No matter what. Even if you get the stock advice from a friend. I was talking to a man today, who's friend had tipped him off on a company called Bre-X Minerals Ltd. a while back. He bought in at just over $1.00 a share and it sky rocketed to $77.00 before he finally sold it. But it kept going up to about $200 per share and he was regretting selling. But what goes up must come down, right? Turns out the company was reporting false information to the media about their company to raise the value of it and sell all their shares in an attempt to get extremely rich. When they were finally caught the stock dropped right off the chart and millions of hard working people lost their pensions, life savings, college money, everything they had. In case you would like to read more here is a link to Wikipedia about the stock.
http://en.wikipedia.org/wiki/Bre-X
Remember: Do your due diligence and make sure you feel comfortable with your decision before buying shares of anything.
Until next time,
James
http://en.wikipedia.org/wiki/Bre-X
Remember: Do your due diligence and make sure you feel comfortable with your decision before buying shares of anything.
Until next time,
James
Subscribe to:
Posts (Atom)