WOW!! It has been a while! I have been busy. I haven't made a lot of progress in the trading game so far though. I have changed my game plan though! I know I have talked a lot about reading charts and stuff. While this is a good thing to know how to do, I would also say it is not the most important. I do urge you to keep learning though. Other very important things you should be doing are reading financial reports on companies and finding out how much work they have been doing and how many shares they have on the market. If you know how many shares are available for purchase, how much each one is worth, how much the company is worth, and how much work the company has done since the last quarter, then you should be able to figure out, roughly, what the price of the stock is going to be the next time they file their reports!!! This will save you a lot of hair loss and binge drinking when you see the stock dip into the red right after you bought it! ahahah. I also like to go to investment blogs and message boards to see what other investors have to say. Sometimes they will even do the math for you! I really like www.bulloards.com The people on this forum are really smart, and good at what they do. I don't comment much, but I do a lot of reading. However, when I ask a question it is always answered by someone and they are usually really nice and helpful.
Right now I hold positions in:
MIT.V (Mint technology Corp.) @ $0.17 I own 18,000 shares. The stock is still currently at this level. I am hoping to see it go to around $1.00 in the next year or so. However, the quarterly reports come out tomorrow. So I will let you know how that goes. I think it should be in the $0.25 range. That would be pretty nice!
NWM.V (NWM Mining Corp.) @ $0.07 I own 24,000 shares. This one is also currently at the seven cent level too. I think I could see as much as $0.09 - $0.10 in the next few days. That wouldn't be too shabby.
I'll keep you posted. Thanks for reading!
Monday 30 April 2012
Wednesday 11 January 2012
My Current Watch List
Canaco Resources Inc TSXV/AlphaV: CAN
Open EC Technologies Inc TSXV/AlphaV: OCE
Biosign Technologies Inc TSXV/AlphaV: BIO
Everything is irie :)
Hey loyal readers!... It's funny cause I know nobody reads this...
Sorry I have not made a post in a while. First it was X-Mas and then I went to Jamaica. I am back now though and ready to do some more learning and trading. While I was in Jamaica I decided not to have any contact with the outside world and just enjoy every minute of it. That being said, I never checked my stocks either... When I returned home I was pleasantly surprised by my charts :) My stock (Trevali Mining: TV.TO) Had jumped ↑30% and the charts were still looking good. So I hung on to the stock. The next day it went up another percent and still looked fine. Then the next day while I was at work it dropped 7%. I had seen it do this before though, so I hung onto it some more. Then it went up 2% more today and I sold it for a total gain of ↑24%. The stock has since dropped 3% more and still looks like it is on a downward trend. Overall I am happy with my decision and my return. Now I need to find another stock!
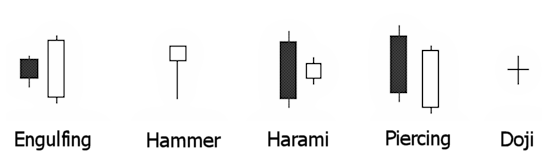
Now to get back into the chart reading stuff! So, as I was saying last time, I like to use what is called the candlestick chart. This type of chart demonstrates trends, highs and lows for any time period along the time line, as well as volume and can help you to get a better understanding of your stock. I recommend using this type of chart. You can tell a lot about what a stock is going to do by learning about candlestick patterns.

These are some very important patters that you are going to want to learn ASAP. Today I will tell you about the first one.
The Engulfing Pattern:
Each candle represents a time period depending on the time line of your chart. To make this easier lets pretend each candle represents a day. From the first candle you can see that the sellers are in control of the stock. However the volume of sellers is pretty low. they are not very aggressive. You can tell because the distance between the top and bottom (high and low) are not very far apart. and the "wick" is showing on either side. The second day is a wide range candle that "engulfs" the previous day's candle. You can see right now that the demand is greater than the supply. This will drive the price up. When researching a stock you want to see patterns like this. Take a good look at the long term time line to see if you can notice any trends. Remember: History always repeats itself. If the stock you are interested in has recently went through a downward trend and you start to see patterns like this, it is a very good indication that it is on it's way back up again. If you see the reverse of this pattern it means the exact opposite. If you see a small white candle being engulfed by a large black candle, you may want to stay away.
Thanks for reading. Next time we will get into the Hammer candle.
-James-
Sorry I have not made a post in a while. First it was X-Mas and then I went to Jamaica. I am back now though and ready to do some more learning and trading. While I was in Jamaica I decided not to have any contact with the outside world and just enjoy every minute of it. That being said, I never checked my stocks either... When I returned home I was pleasantly surprised by my charts :) My stock (Trevali Mining: TV.TO) Had jumped ↑30% and the charts were still looking good. So I hung on to the stock. The next day it went up another percent and still looked fine. Then the next day while I was at work it dropped 7%. I had seen it do this before though, so I hung onto it some more. Then it went up 2% more today and I sold it for a total gain of ↑24%. The stock has since dropped 3% more and still looks like it is on a downward trend. Overall I am happy with my decision and my return. Now I need to find another stock!
Now to get back into the chart reading stuff! So, as I was saying last time, I like to use what is called the candlestick chart. This type of chart demonstrates trends, highs and lows for any time period along the time line, as well as volume and can help you to get a better understanding of your stock. I recommend using this type of chart. You can tell a lot about what a stock is going to do by learning about candlestick patterns.
These are some very important patters that you are going to want to learn ASAP. Today I will tell you about the first one.
The Engulfing Pattern:
Each candle represents a time period depending on the time line of your chart. To make this easier lets pretend each candle represents a day. From the first candle you can see that the sellers are in control of the stock. However the volume of sellers is pretty low. they are not very aggressive. You can tell because the distance between the top and bottom (high and low) are not very far apart. and the "wick" is showing on either side. The second day is a wide range candle that "engulfs" the previous day's candle. You can see right now that the demand is greater than the supply. This will drive the price up. When researching a stock you want to see patterns like this. Take a good look at the long term time line to see if you can notice any trends. Remember: History always repeats itself. If the stock you are interested in has recently went through a downward trend and you start to see patterns like this, it is a very good indication that it is on it's way back up again. If you see the reverse of this pattern it means the exact opposite. If you see a small white candle being engulfed by a large black candle, you may want to stay away.
Thanks for reading. Next time we will get into the Hammer candle.
-James-
Monday 19 December 2011
Daily update:
Hi again. The stock I am currently invested in (Trevali Mining Co.) has gone up once again. :) Today it closed ↑1.1% Higher than Friday. Zynga, on the other hand, is now down to ↓$9.05. This is interesting because of all they hype it had... Now experts are saying it might drop as low as $6.00... Now I am kind of glad I didn't put any money into it. :)
Anyways, about that bar chart I promised to talk about today. That chart illustrates the volume of traders in the corresponding time frame. Green stands for buyers and red stands for sellers. The colors may vary from chart to chart. If you are checking out stocks and notice a high volume of buyers it's a good indication that the stock is going to go up. However, make sure you aren't too late if you do decide to buy. That's all I've got for today. I am currently learning a lot about candle stick charts. I recommend using a candle stick chart when you are studying a stock. I will let you know why in my next few posts. There is A LOT you can tell about a stock by using these charts.
James
Friday 16 December 2011
The ADX indicator
Hello! If you remember, or were reading, a couple posts ago I said I would be talking about how to identify if a trend is strong or weak and which way it's going. However, I would first just like to say that the stock I bought yesterday (Trevali Mining Corporation. TSX: TV) Has gone up $0.03 (3.55%) Since I purchased it. That's like $20 in my pocket! Also, Zynga. The stock I was talking about the other day. The one that it anticipated to be as strong as google has dropped ↓5% from $10.00 to $9.50. For the people who got in early, this is a bad thing. But for anyone who still hasn't made a purchase, this could be a good thing. 40 million shares of this stock were purchased when the market opened. The stock jumped up 25% and then a lot of people sold bringing it crashing down to $9.50. Since then it has been pretty steady for the rest of the day. I don't think it is going to go much lower than that. I think it's all uphill from here for the next little while. Unfortunately I do not have money to buy shares. At least not that I am willing to spend. If my current stock goes well and I sell soon, I will be putting my money into Zynga if it hasn't gone up too much by then. My guess is though, that tomorrow a lot of people will buy it again and it will jump even higher than $12.50 and it will keep "waving" its way up from there. Never quite dropping as low as it did the time before. ANYWAYS! Enough of that!
How to tell what a trend is doing: this is not a perfect science. But it sure is helpful. When looking at a chart you want to take note of what way the stock is moving. Is it trending upwards or downwards? Now, look at the ADX indicator. It is a horizontal line on a chart that ranges from 0 -100 (might look like 10-90)depending on the range it passed through during the time line of the chart. Here's an example, outlined in red, from the stock i talked about earlier. (TSX: TV)

If the line goes above 30 this is a really good thing. It means you are looking at a pretty strong trend. If you want to be really safe you would invest in stocks that are trending in an upward manner of 30 or more. The ADX will not tell you if it is moving up or down. Only how much "momentum" it has. It's up to you to decide if it is going up or down. A good way is to try and recognize the "waves" and "stages" I talked about in my earlier posts. If you looked at Zynga right now (as I am typing this) you would see that the ADX is over 60 right now! And this stock is not going down! Sorry, I got excited. Anyways, that's all I have for you today. Hope you learned something. Next time I will tell you about the bar chart above the ADX indicator :)
James
Thursday 15 December 2011
My first purchase. FOR REAL!
Wooo! I just bought 600 shares of Trevali Mining Corporation THROUGH MY TFSA! It is listed on the TSX as TV. This is a Canadian company that mines copper and zinc. It is currently selling at $0.83 cents per share after a recent drop from around $2.30 earlier this year. Here is the Year To Date Chart.

As you can see it has clearly gone through stage 4 of its last cycle. I believe it is now leveling off and ready to go back up. I didn't decide to buy it solely on the fact that it has leveled off. That was actually the second reason why I bought it. Before I did anything, I looked it up. On December 7th this company staked five additional claims to mine at, adding 1,130 more hectares of land to its already 3764 hectare stake bringing it to a total of 4894 hectares. This is a good sign that they have a pretty good idea that there is more copper and zinc to be found. If that wasn't enough, today they have just received a lease for yet another mine in which they believe is full of zinc, copper, lead, and gold. The lease is good for twenty years and they are able to renew it for twenty more years up to a total of 80 years. This is a good sign that there is plenty to be dug up! Furthermore, They have already told Xstrata Zinc Canada's Brunswick 12 Processing Mill and Concentrate Complex to expect delivery of feed over the upcoming weeks. I am pretty damn excited! :) I didn't buy a whole lot of shares, but this is my first trade. If I even make $5 I will be happy. Anyways, That's all for now! See you next time!
James
Happy X-mas, NASDAQ!
Today is the day that Zynga FINALLY registered an IPO. Look them up under ZNGA. This is the most anticipated IPO since Google! Google started at $85.00 per share and is now at around $620.00. Zynga started today at only $10.00 per share. I will not be buying any shares because I simply don't have enough money to make a reasonable purchase... Also, by market opening in the morning, Wall street will be packed with investors and there probably won't be any shares left to buy at around 9:05am. This stock is expected to make a lot of millionaires and even billionaires. I personally will be torturing myself watching this one for years to come, wishing that I maxed out my line of credit to get a piece. Just thought I would put that out there. This blog is now a piece of investing history. One of the many posts that was posted the day Zynga entered the public market. That's all for now.
James
James
Subscribe to:
Posts (Atom)